Vehicle Aerodynamics with CFD: How to Reduce Drag on Cars, Trucks and EVs

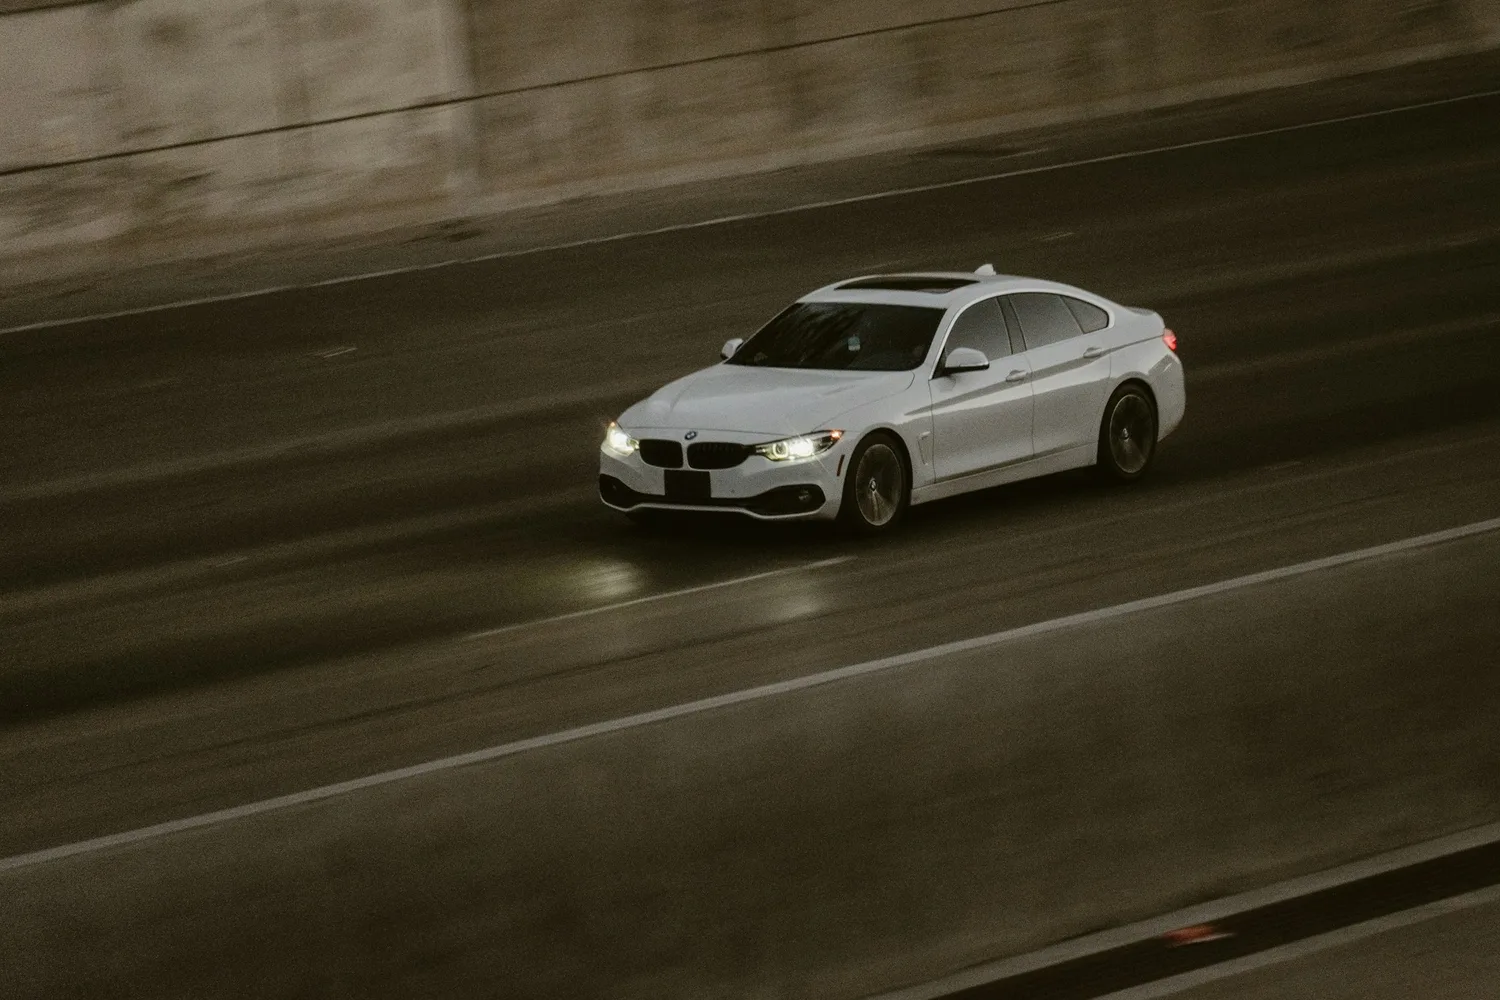
Introduction
At motorway speeds, aerodynamic drag is one of the biggest forces a car, van or truck has to overcome. Drag grows with the square of speed and the power needed to push through it grows with the cube, so a shape that is fine around town can cost a lot of fuel, or electric range, on the motorway.
Computational Fluid Dynamics (CFD) shows exactly where that drag comes from, long before a wind tunnel or a prototype is booked. This guide explains how vehicle aerodynamics is simulated, where the biggest gains usually are, and how to get results you can trust.
Why Aerodynamics Matters More Than Ever
- Fuel and CO2: lower drag means lower fuel use and emissions, which count towards fleet CO2 targets.
- Electric range: electric drivetrains are so efficient that drag makes up a bigger share of the energy used on the motorway. Less drag means more range, or the same range from a smaller, cheaper battery.
- Trucks and buses: large frontal areas and long hours at constant speed mean small drag savings add up to large fuel savings across a fleet.
- Stability, noise and cooling: lift and side forces affect high-speed stability, wind noise is more noticeable in quiet electric cars, and engines, batteries and brakes all need cooling air.
Drag depends on the drag coefficient (Cd) multiplied by the frontal area. Most modern passenger cars have a Cd of around 0.25 to 0.35, the most streamlined production cars are close to 0.20, and tractor-trailers are often around 0.6 or more.
Where the Drag Comes From
On a road vehicle, most of the drag is pressure drag caused by the low-pressure wake behind it, not friction on its surfaces. The main contributors are:
- The rear end and wake: where the flow separates from the body decides how big the wake is. Our CFD study of an Ahmed body, the standard simplified car shape used in aerodynamics research, shows how changing the rear slant angle changes where the flow separates, the size of the wake and the drag.
- Wheels and wheel arches: rotating wheels and open arches create a lot of turbulence and a large share of the total drag.
- The underbody: exhausts, suspension parts and uneven panels disturb the flow under the car.
- Cooling airflow: air passing through the grille, radiator and engine or motor bay adds what is known as cooling drag.
- Mirrors, gaps and details: mirrors, pillars, handles and panel gaps, and on trucks the gap between the cab and the trailer.
Flow separation is the key physics in all of these. Our CFD study of a backward-facing step, validated against experimental data, shows how a CFD model captures separation and reattachment, the same behaviour that sets the wake behind a vehicle.
How a Vehicle CFD Study Works
- Geometry preparation: the CAD model is cleaned up and the level of detail chosen, for example a smooth or fully detailed underbody.
- A virtual wind tunnel: the vehicle sits in a domain large enough to avoid blockage, with a moving ground and rotating wheels so the model sees the road the way the vehicle does.
- Meshing: thin layers of cells on the body capture the boundary layer and refined zones follow the wake. Full vehicle models typically run to tens of millions of cells.
- Turbulence modelling: steady RANS models such as k-omega SST are fast and ideal for comparing many design variants. Scale-resolving methods such as DES or LES capture the unsteady wake more accurately when absolute numbers matter.
- Results: drag and lift coefficients, surface pressure, wake and streamline plots, and cumulative drag plots that show where along the vehicle the drag builds up.
In our CFD drag optimisation of a Formula One front wing, velocity contours and streamlines showed where the flow separated and how design changes reduced drag while keeping downforce.
Practical Ways to Reduce Drag
- Rear end: a gentle taper, a sharp trailing edge at the right height, spoilers and diffusers all help the flow leave the body cleanly and shrink the wake.
- Wheels: flatter wheel designs, air curtains that guide air past the front wheels and tight arch gaps.
- Underbody: flat underbody panels and a rear diffuser.
- Cooling: active grille shutters that close when little cooling is needed, and sealed ducts so all the air that enters the grille does useful work.
- Details: slimmer mirrors or camera mirrors where regulations allow, flush handles and smaller panel gaps.
- Trucks and trailers: roof deflectors, side skirts, cab-to-trailer gap reduction and rear trailer tails.
- Ride height: lowering the vehicle at speed, for example with air suspension.
Cooling ducts need the same care as the outside of the vehicle. Our CFD analysis of a cooling duct shows how the duct shape controls the flow distribution and the pressure loss, which decide how much cooling air a design needs.
Beyond Drag: Lift, Crosswind, Noise and Soiling
- Lift and balance: lift at the front and rear affects high-speed stability, and in motorsport downforce is a goal in its own right.
- Crosswind: side forces and yaw moments matter for tall vans, trucks and buses, and for any vehicle on an exposed bridge.
- Wind noise: CFD finds the noise sources around mirrors, pillars and seals. Without engine noise to cover it, this is what drivers of electric cars hear.
- Soiling and water: simulation shows where spray and dirt land on windows, lamps and the cameras and sensors used by driver assistance systems.
- Brake and thermal management: brakes, batteries and power electronics all need enough cooling air in the worst conditions.
CFD and the Wind Tunnel
CFD does not make the wind tunnel obsolete; it makes it far more productive. Simulation explores dozens of variants quickly and cheaply, and only the most promising ones go to the tunnel or the test track. Where tunnel or coast-down data exists, we compare against it to confirm the model before relying on it.
It also matters for official figures: fuel consumption and range tests such as WLTP use road-load values measured on the real vehicle, so aerodynamic gains show up in the published numbers. If you are choosing a CFD tool for this kind of work, our comparison of CFD software explains the trade-offs.
What We Need to Start
- 3D CAD of the vehicle or component (STEP, IGES, Parasolid or native files), or drawings for our 3D CAD team to model.
- The conditions: vehicle speed, yaw angles, ride height and whether the wheels should rotate.
- What you want to improve, such as drag, lift, cooling flow, noise or soiling, and your targets.
- Any wind tunnel, coast-down or track data you already have.
Frequently Asked Questions
What drag coefficient should a modern car have?
Most modern passenger cars are around 0.25 to 0.35, and the most streamlined production cars are close to 0.20. What decides energy use is the drag coefficient multiplied by the frontal area, so a tall SUV with a good drag coefficient can still have more drag than a low saloon.
How accurate is CFD for vehicle aerodynamics?
A well-built model reliably ranks design changes and shows where the drag comes from. Absolute values depend on the level of detail and the turbulence model, so we compare against wind tunnel or test data whenever it is available.
Can you simulate rotating wheels and a moving road?
Yes. A moving ground and rotating wheels are standard in our vehicle models, because a stationary floor and wheels give a misleading picture of the underbody and wheel flow.
Do you work on trucks, buses and trains as well as cars?
Yes. The same methods apply to vans, trucks, trailers, buses, trains and motorsport vehicles, and to individual parts such as mirrors, spoilers and cooling modules.
How do we get a quote?
Send your CAD files, speeds and targets through our contact page. We will reply with a scope, timeline and quote.
Find the Drag Before You Build
Whether you are shaping a new car, improving a truck or trailer, or chasing extra electric range, our engineers can show you where the drag comes from and which changes remove it. Send us your CAD files and targets, and we will reply with a clear scope and quote.
Cover photo: Nishat Samadzai on Unsplash