
Home / Projects / CFD of a Backward-Facing Step: Flow Separation and Reattachment Validated Against Experiment
CFD of a Backward-Facing Step: Flow Separation and Reattachment Validated Against Experiment
The backward-facing step is one of the most studied flows in all of CFD, and for good reason. It looks simple, just a channel with a sudden drop in the floor, but that step forces the flow to separate, swirl back on itself in a recirculation zone, and then reattach to the wall further downstream. Getting a simulation to reproduce that separation and reattachment correctly is a real test of a turbulence model, which is why the step is used as a benchmark. This project set up a backward-facing step in Ansys Fluent and checked the results against the classic experimental data of Driver from 1985.
The geometry followed the benchmark directly, with a step height of 1.27 cm, a domain eight step heights tall and twelve step heights long, and air entering at 20 m/s. The point was not just to produce a nice picture of the flow, but to measure the wall static pressure along both walls and compare it to the published experimental results, so the model could be trusted rather than just admired.
Objectives and the Benchmark
The aim was to build a backward-facing step simulation that reproduces the real flow physics and to prove it against trusted experimental data rather than take it on faith. The objectives were:
- Model the turbulent flow over a backward-facing step at the same geometry and conditions as the Driver 1985 experiment.
- Capture the separation at the step, the recirculation zone behind it, and the reattachment of the flow further downstream.
- Measure the wall static pressure coefficient along both the step-side wall and the opposite wall.
- Compare the pressure coefficient directly against the published experimental graph to validate the model.
- Test how sensitive the results are by changing the inlet velocity and the step height by plus and minus ten percent.
The backward-facing step matters well beyond the textbook. The same separation and reattachment happens behind cars, over aircraft flaps, inside diffusers, and in combustor and cooling passages, so a model that gets the step right is a model you can lean on for real designs.
Computational Domain and Mesh
The domain was drawn in Ansys as a two-dimensional channel with the step set into the floor, matching the benchmark proportions so the comparison would be fair. The setup was:
- Step height of 1.27 cm, taken straight from the Driver benchmark.
- Domain eight step heights tall and twelve step heights long, so the flow has room to separate and fully reattach.
- Named inlet, outlet, and top and bottom walls, so the boundary conditions could be applied cleanly.
- Edge sizing of 250 divisions along the top and bottom walls, giving a mesh of about 8,032 elements and 8,440 nodes.
Refining the mesh along the walls is deliberate. The interesting physics of a backward-facing step lives right at the surface, in the separated shear layer and the reattachment point, so that is where the cells need to be closest together if the wall pressure is going to come out right.
Solver Setup and Boundary Conditions
The case was solved in Ansys Fluent as a steady, pressure-based simulation, with settings chosen to resolve the turbulent separated flow accurately:
- Turbulence model: the k-omega model in its standard form, which handles near-wall and separated flow well.
- Inlet: air entering at 20 m/s in the streamwise direction.
- Outlet: a pressure outlet open to the surroundings.
- Walls: no-slip top and bottom walls, including the step face.
- Numerics: a second-order upwind scheme for momentum and the turbulence equations, for a more accurate solution.
Second-order upwind is worth the extra effort here. A first-order scheme tends to smear out exactly the sharp gradients in the shear layer that decide where the flow reattaches, so using second order keeps the result honest.
Velocity and Pressure Results
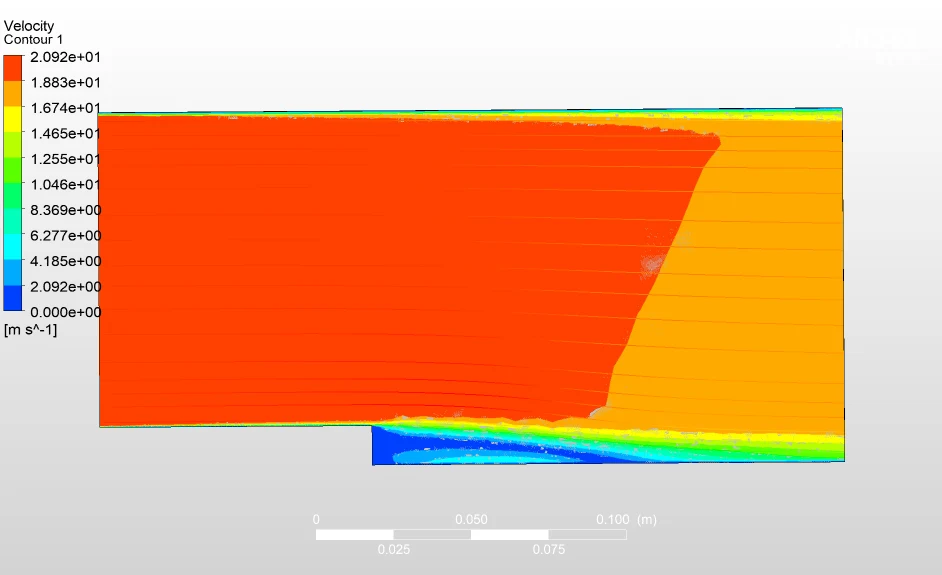
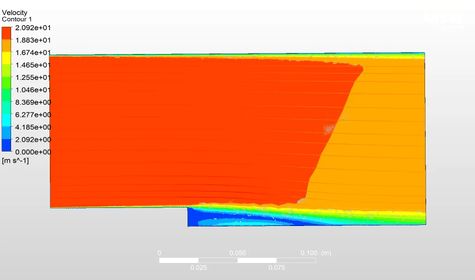
The velocity contour, shown above, captures the whole story of the step in one picture. The flow arrives from the inlet at its full 20 m/s, then separates cleanly at the edge of the step. Behind the step there is a pocket of slow, recirculating fluid where the velocity drops to near zero, and above it the fast flow carries on before bending down and reattaching to the lower wall. That low-speed recirculation zone is the signature of a backward-facing step, and the model reproduces it clearly.
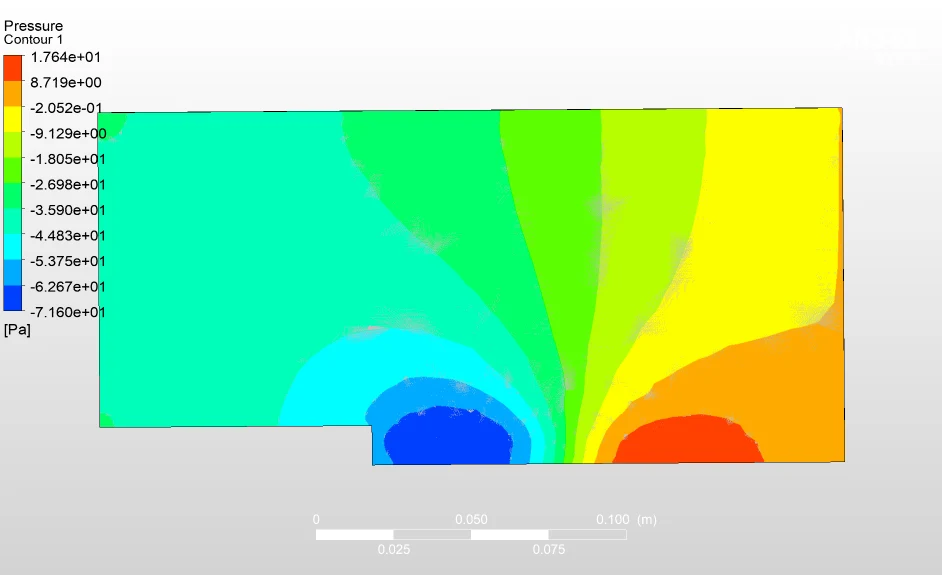
The pressure field fits the velocity picture exactly. Pressure is lowest through the recirculation region just behind the step, and then it recovers and reaches its highest value further downstream, near the outlet where the flow has reattached and slowed, at around 1.75 Pa. This rise in pressure as the flow reattaches is called pressure recovery, and it is one of the main things engineers care about, because poor pressure recovery in a diffuser or a duct means lost efficiency.
Reading the two fields together, the low-pressure core sitting inside the low-velocity recirculation zone, gives a consistent and physically sensible picture of the flow, which is the first sign that the simulation is behaving correctly.
Validation Against Driver's Experimental Data
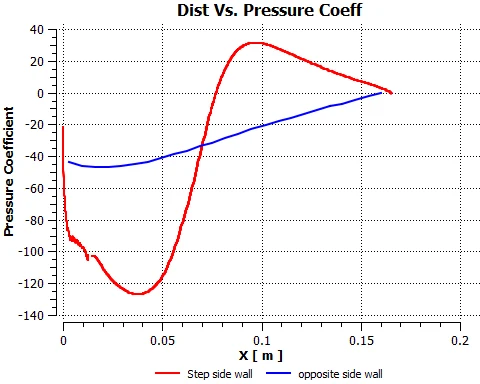
A nice-looking contour is not proof of anything on its own, so the real test was the wall pressure. The static pressure coefficient was measured along two lines, one on the step-side wall and one on the opposite wall, each split into twelve stations along the length, and then plotted against distance so it could be laid next to the experimental data.
The simulation reproduces the shape of the experimental curves. On the step-side wall the pressure coefficient starts near zero, dips into negative values through the recirculation region as the streamlines lift away from the surface, then climbs back up and levels off once the flow reattaches. On the opposite wall the pressure coefficient rises gently and settles to a steady value, as the flow there stays attached the whole way along.
This is exactly the behaviour reported in Driver's experiment, and seeing the CFD follow the same trend on both walls is what turns the model from a picture into a validated result.
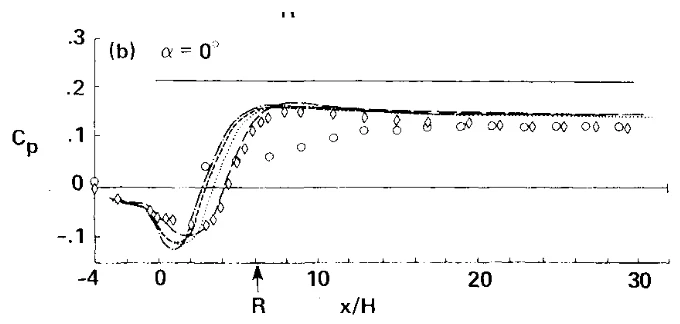
For reference, the published experimental pressure distribution from the benchmark study is shown below. Comparing the two side by side, the simulated curves follow the same rise, dip, and recovery as the measured data, which is the outcome the whole project was built to demonstrate.
Sensitivity to Inlet Velocity and Step Height
To see how robust the result is, the inlet velocity and the step height were each changed by plus and minus ten percent and the pressure coefficient was plotted again. The two graphs below show the effect.
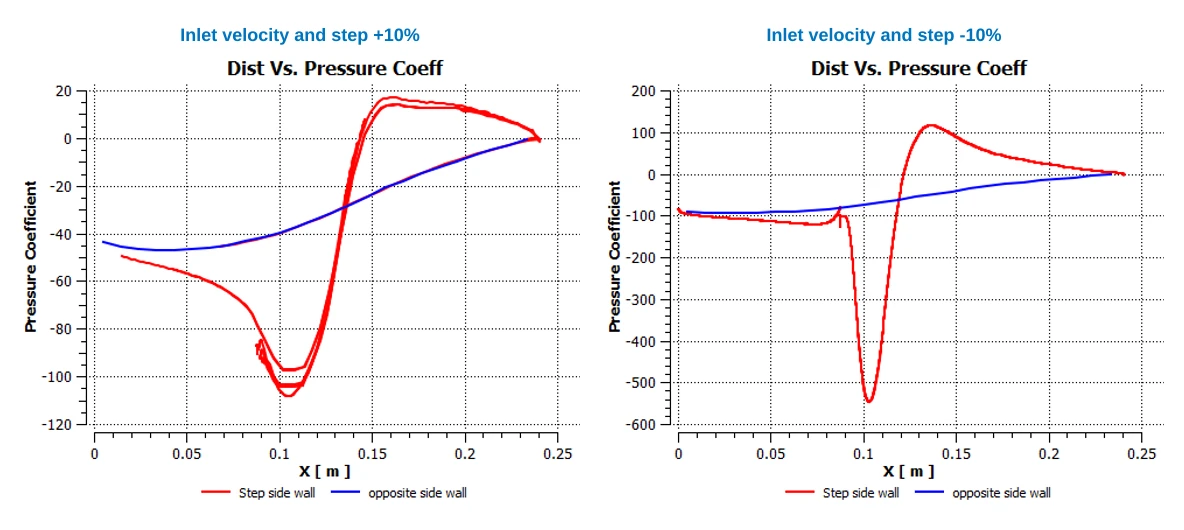
The pattern is clear and physically sensible. When the velocity and step size are increased by ten percent, the pressure coefficient dips more deeply through the recirculation region before climbing back, as the stronger, larger recirculation pulls the pressure lower. When they are decreased by ten percent, the dip is shallower and gentler and the recovery is smoother. The overall shape of the curve holds in both cases, which shows the model responds to changes in the way you would expect rather than jumping around, and that the validated behaviour is not a one-off tied to a single set of numbers.
Separation and Reattachment CFD at Solvo Engineers
Separation, recirculation, and reattachment turn up wherever a flow meets a sudden change in shape, behind vehicles, over wings and flaps, through diffusers and ducts, and inside cooling and combustion passages. These flows are hard to predict by intuition, and the value of CFD here is not only in showing the recirculation but in being checked against known data so the numbers can be trusted. Validating a model against a benchmark like the backward-facing step, as we did here, is what gives the confidence to then use it on a design where no experimental data exists yet.
At Solvo Engineers we run separated and turbulent flow CFD in Ansys Fluent for internal and external flows, including diffusers, ducts, vehicle aerodynamics, and benchmark validation studies, alongside our wider CFD and FEA consulting work. If you have a flow that separates, recirculates, or reattaches, and you need it modelled and verified, our team can help. Reach out through our contact page and talk it through with a CFD engineer.
Our Projects
See how Solvo Engineers has helped its clients achieve their vision of digital innovation.
Our Technologies
 Contact Us
Get in touch with us