
Home / Projects / CFD Aerodynamic Analysis of an Aircraft Wing and Winglet Design for Lift and Drag
CFD Aerodynamic Analysis of an Aircraft Wing and Winglet Design for Lift and Drag
Project Summary
Every aircraft wing is a trade-off between lift and drag and the wingtip is where a lot of that trade-off is won or lost. This project used computational fluid dynamics (CFD) in Ansys Fluent to study the airflow over an aircraft wing built on the Aerospatiale-A airfoil and to compare two designs: a plain wing and a wing fitted with three winglets set at different angles. The aim was to see how the flow behaves around each one and how the winglets change the aerodynamic picture.
The case was run at a 13.3 degree angle of attack with a chord length of 1 m and a free stream Reynolds number of about 2.07 million, using a pressure based solver on a finely meshed domain around the wing. Lift and drag were monitored to convergence for both designs and the pressure, Mach number, dynamic pressure and turbulent intensity fields were pulled out to show what the flow is actually doing across the wing surface.
Objectives and Approach
The study set out to compare the aerodynamics of two wing designs and to understand the flow behind the numbers. The objectives were:
- Model the airflow over a plain wing and over a wing with three winglets, using the same airfoil and the same flow conditions for a fair comparison.
- Monitor lift and drag through the solution so the aerodynamic behaviour of each design could be compared as the run converged.
- Map the pressure coefficient and Mach number over the wing to see where the wing is working hardest and where the flow accelerates.
- Look at the turbulent intensity and dynamic pressure, especially at the wingtip, where winglets do their work.
The wing was built on the Aerospatiale-A airfoil with a 1 m chord, and the flow domain was extended well away from the wing so the boundaries would not interfere with the result. A quadrilateral mesh was refined close to the wing surface, where the pressure and velocity gradients are steepest and the case was solved as a steady state problem with a k-epsilon turbulence model. The same setup was then applied to the three-winglet wing so the two could be compared directly.
Simulation Setup and Conditions
The analysis was carried out in Ansys Fluent with the following main settings:
- Airfoil and geometry: Aerospatiale-A airfoil, 1 m chord, modelled first as a plain wing and then as a wing with three winglets set at angles of 90, 0 and minus 90 degrees.
- Flow condition: 13.3 degree angle of attack at a free stream Reynolds number of roughly 2.07 million.
- Solver: pressure based, steady state, with a k-epsilon turbulence model and air treated as an ideal gas.
- Mesh: quadrilateral cells refined near the wing surface to capture the boundary layer and the sharp gradients around the leading edge and the tip.
- Monitors and outputs: lift and drag tracked to convergence, plus contour results for pressure coefficient, Mach number, dynamic pressure and turbulent intensity.
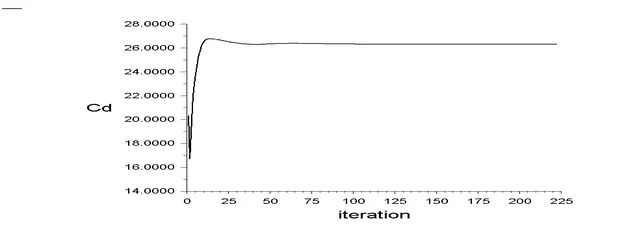
Both cases were run to a converged, steady solution, with the lift and drag monitors levelling off and holding flat, which is the sign that the aerodynamic loads have settled and the contour results can be trusted.
Results and Findings
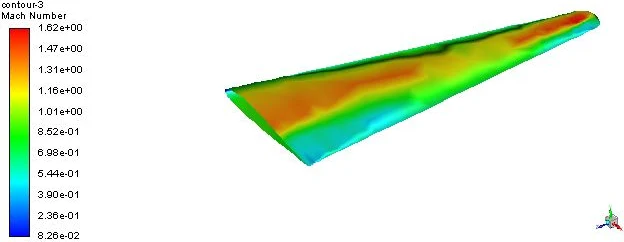
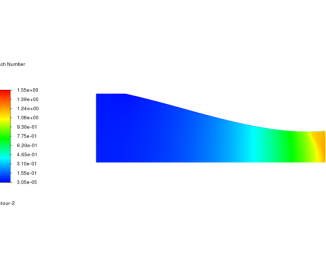
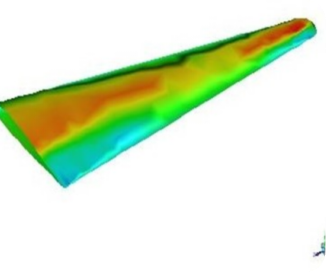
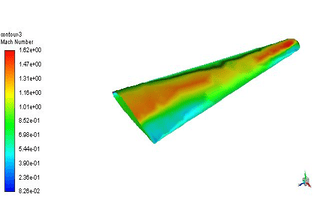
The contour results tell a clear aerodynamic story. The Mach number map, shown above, is the most striking. Even though the free stream is well below the speed of sound, the air accelerates so much as it wraps around the curved upper surface and the leading edge that it reaches local Mach numbers above 1, meaning small pockets of the flow briefly go supersonic. Those pockets are exactly the high-suction regions that generate most of the wing's lift and they sit where you would expect, along the upper surface near the leading edge.
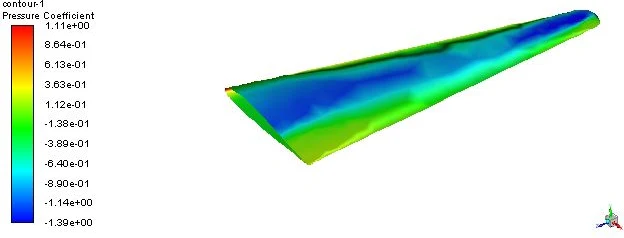
The pressure coefficient field backs this up. It runs from about minus 1.39 on the upper surface to just above 1 near the leading edge stagnation point, which is the classic aerofoil signature: strong suction over the top, higher pressure underneath and the difference between the two is the lift. The band of low pressure along the upper surface is where the wing does most of its lifting work.
The pressure coefficient is a clean, dimensionless way to read this, because it does not depend on how fast the air is moving, only on the shape of the flow. That is why it is the first thing an aerodynamicist looks at when comparing two wing designs.
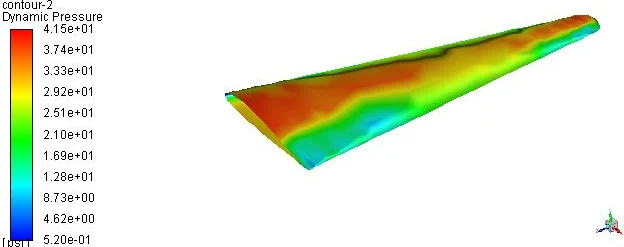
The dynamic pressure contour shows where the moving air carries the most energy, which is highest across the upper surface and feeds directly into the aerodynamic forces on the wing. Reading it alongside the pressure and Mach results gives a full picture of how the load is spread from the leading edge back towards the trailing edge.
Comparing the plain wing with the three-winglet design is the heart of the study. Winglets earn their place by working the wingtip, where the high pressure under the wing tries to curl around to the low pressure on top and rolls up into a trailing vortex. That vortex is the source of induced drag and it is the single biggest reason a real wing loses efficiency.
The turbulent intensity result makes the wingtip behaviour visible. The turbulence peaks at the tip and along the winglet edges, which is the footprint of the tip vortex forming and the winglets interacting with it. By splitting the single strong tip vortex into smaller ones, a multi-winglet arrangement spreads out and weakens that roll-up, which is the mechanism behind the lift and drag differences between the two designs.
Across the comparison, the three-winglet wing changed the tip flow and the loading in the way winglets are known to, altering the balance of lift and drag relative to the plain wing. The contour set gives the client a clear, visual account of why the two wings behave differently, rooted in the flow physics rather than a single headline number.
Aerospace and Aerodynamic CFD at Solvo Engineers
Wings, winglets and control surfaces all come down to the same question: how much lift for how much drag and CFD is how that question gets answered before anything flies. A good simulation shows the pressure distribution, the Mach field and the wingtip vortices that drive induced drag, so a design can be judged and improved on the aerodynamics rather than on guesswork. Comparing a plain wing against a multi-winglet wing, as we did here, is exactly the kind of study that turns a design idea into evidence.
At Solvo Engineers we run aerodynamic CFD in Ansys Fluent and STAR-CCM+ for wings, winglets, UAVs, propellers and other external flow problems, covering lift and drag, pressure and Mach fields and wingtip vortex behaviour, alongside our wider CFD and FEA consulting work. If you are developing a wing, a winglet or any aerodynamic surface and want to understand its performance before you build it, our team can help. Reach out through our contact page and talk it through with a CFD engineer.
Our Projects
See how Solvo Engineers has helped its clients achieve their vision of digital innovation.
Our Technologies
 Contact Us
Get in touch with us