Project overview
Ducts carry the cooling air in HVAC systems, electronics cooling, battery thermal management and industrial ventilation. When the flow inside separates, recirculates or loses too much pressure, cooling becomes uneven and the fan has to work harder, so the duct design directly affects the performance and reliability of the whole system.
In this project we ran a detailed computational fluid dynamics (CFD) analysis of a custom curved duct in Ansys Fluent 2024 R2. The duct contains internal parts designed to improve heat transfer and airflow distribution. We looked for high-velocity zones, pressure drop regions and flow separation, to guide design changes towards more uniform cooling, less recirculation and better aerodynamic efficiency.
Objectives
How we built the duct CFD model
Geometry with internal parts
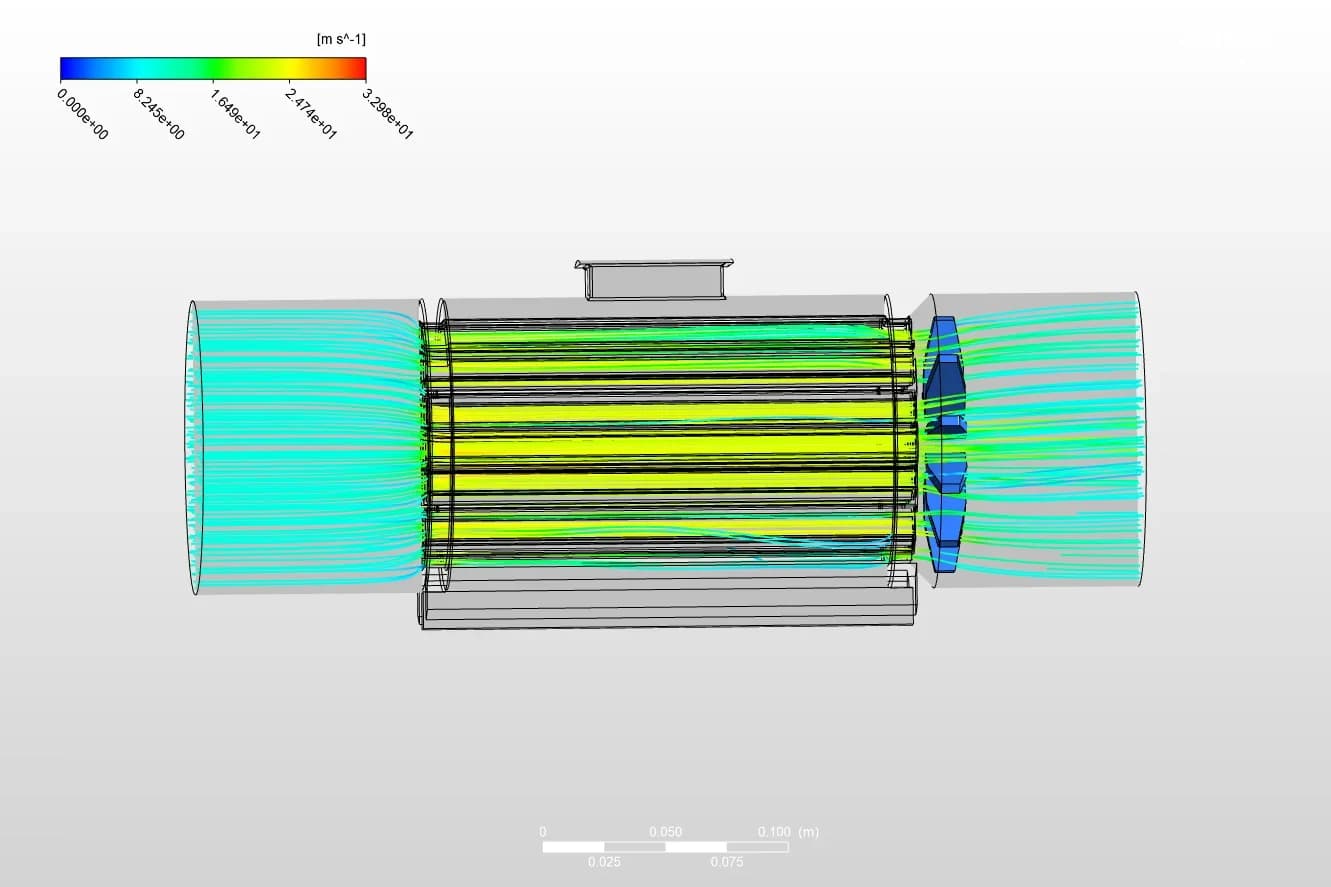
The model included the duct's turning vanes, flow splitters and an impeller-like fan, all of which strongly affect the flow's direction and speed.
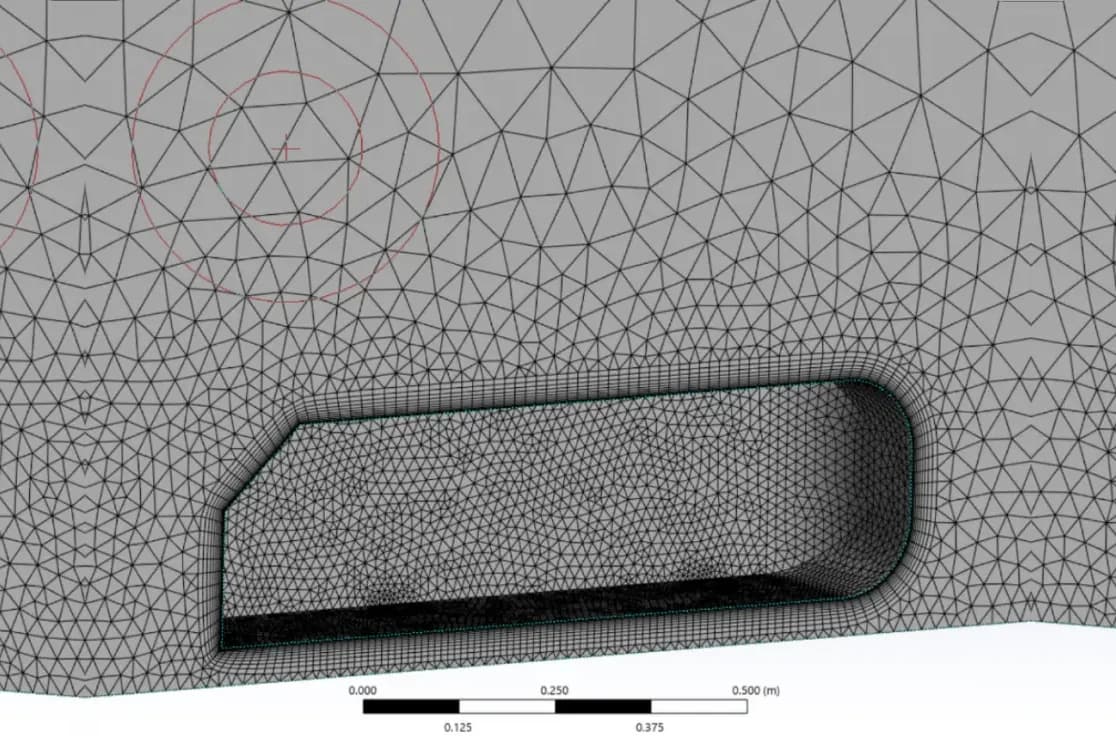
Fine mesh
A fine grid throughout, especially in the curved and confined regions where the flow details matter most.
Flow model
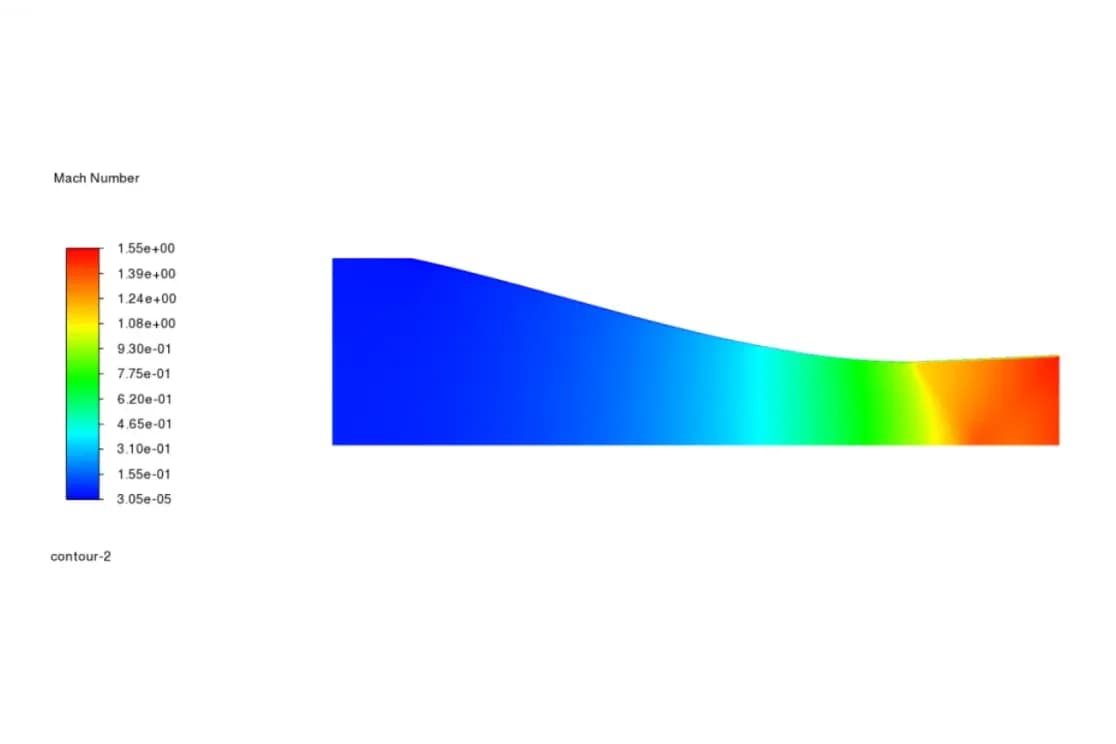
Steady-state, incompressible flow, solved in Ansys Fluent 2024 R2.
Turbulence model
The SST k-ω model, to resolve the near-wall effects that control separation and pressure losses.
Results review
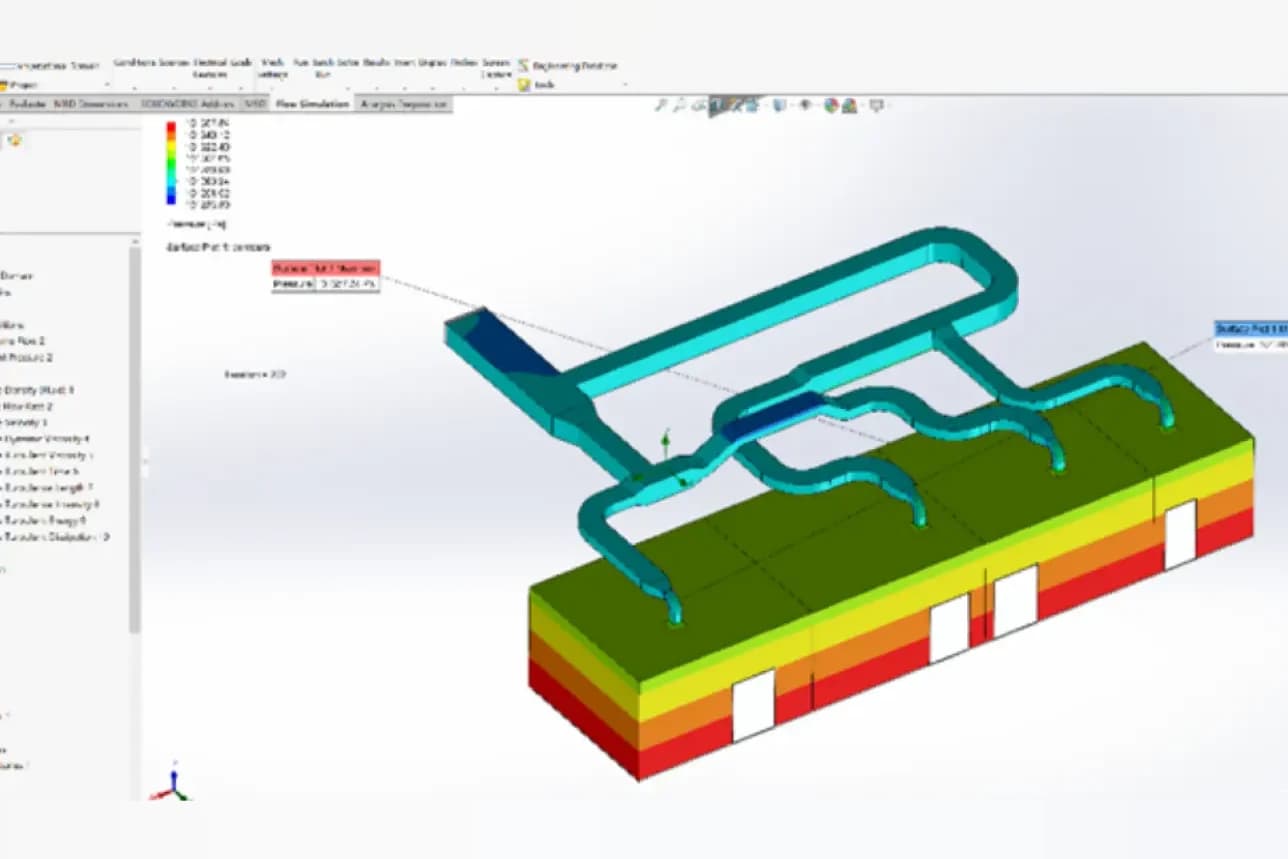
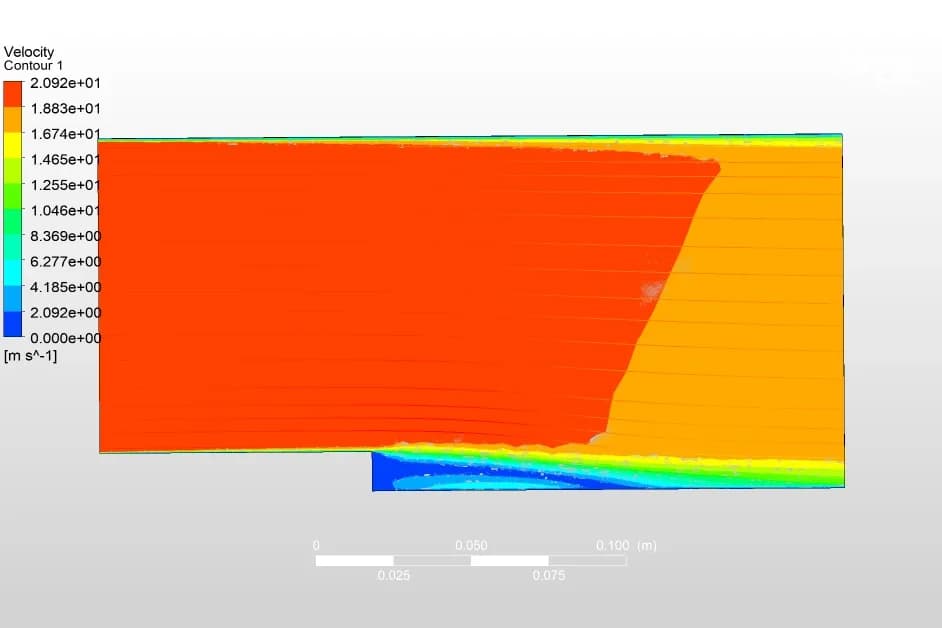
Velocity streamlines and pressure contours, reviewed to find where the flow loses energy and where the design can improve.
Results: velocity and pressure through the duct
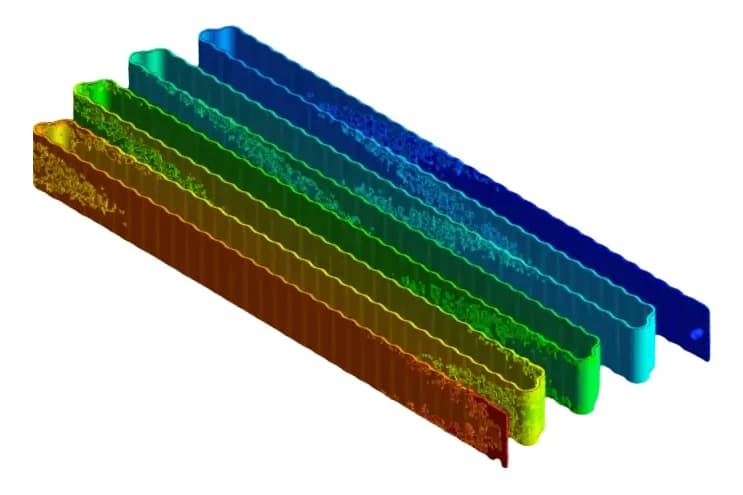
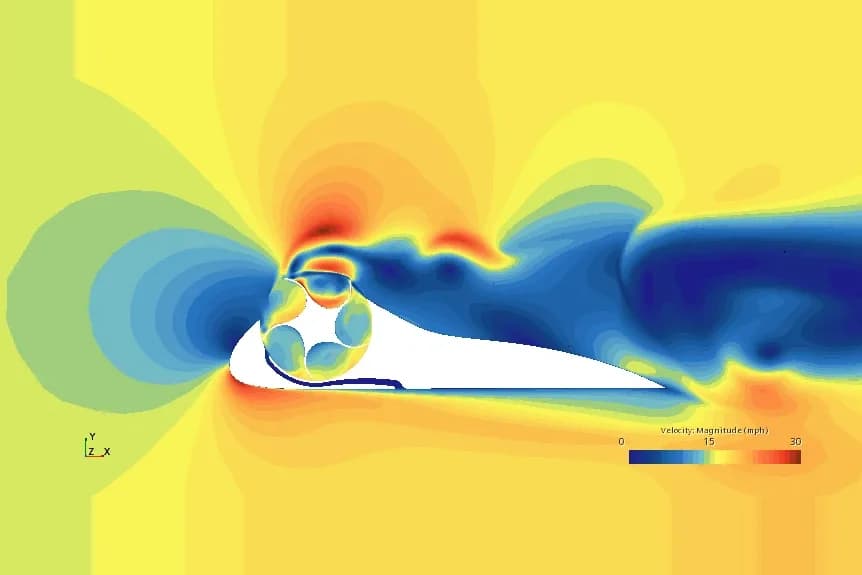
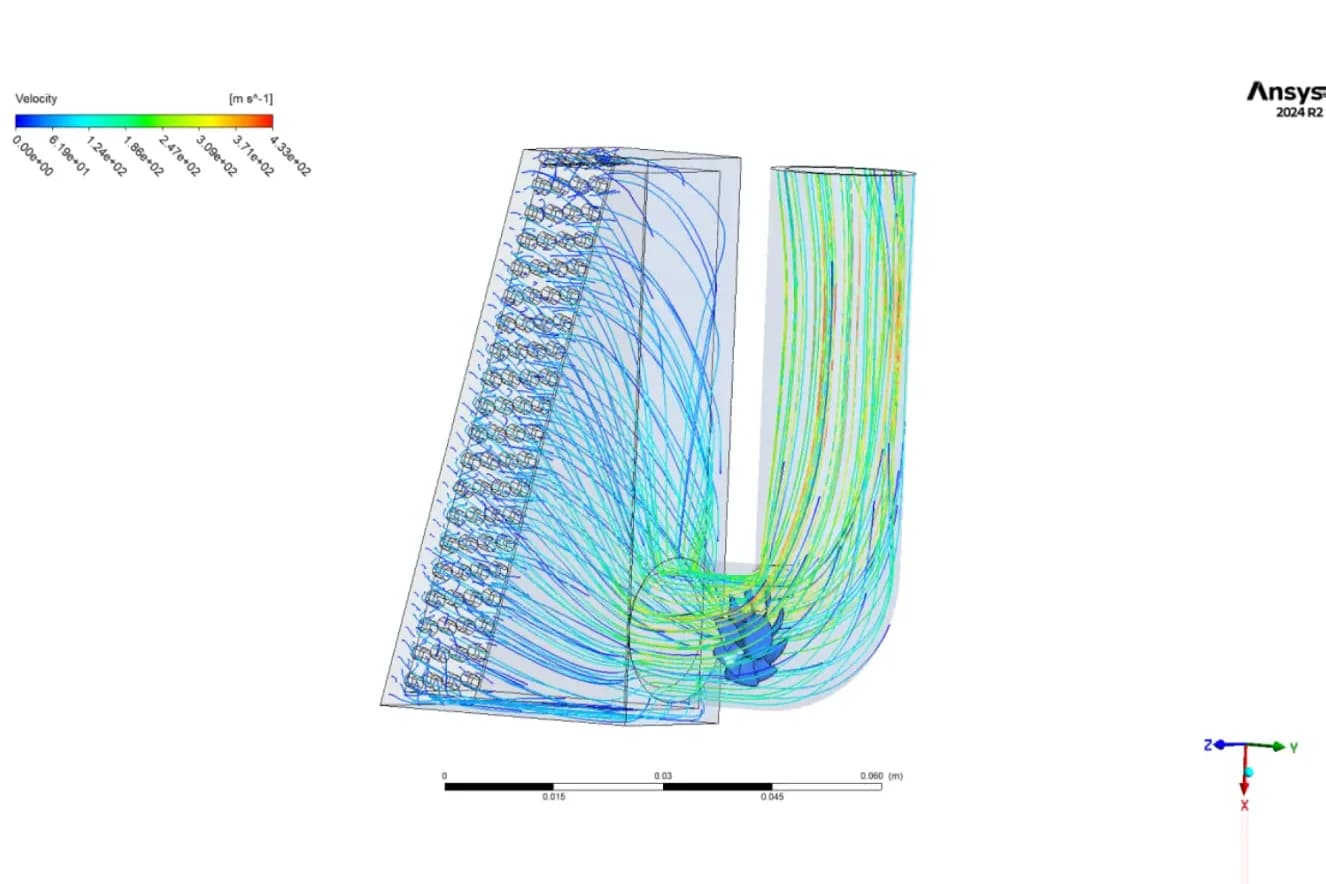
The velocity streamlines, shown at the top of this page, follow the air through the duct:
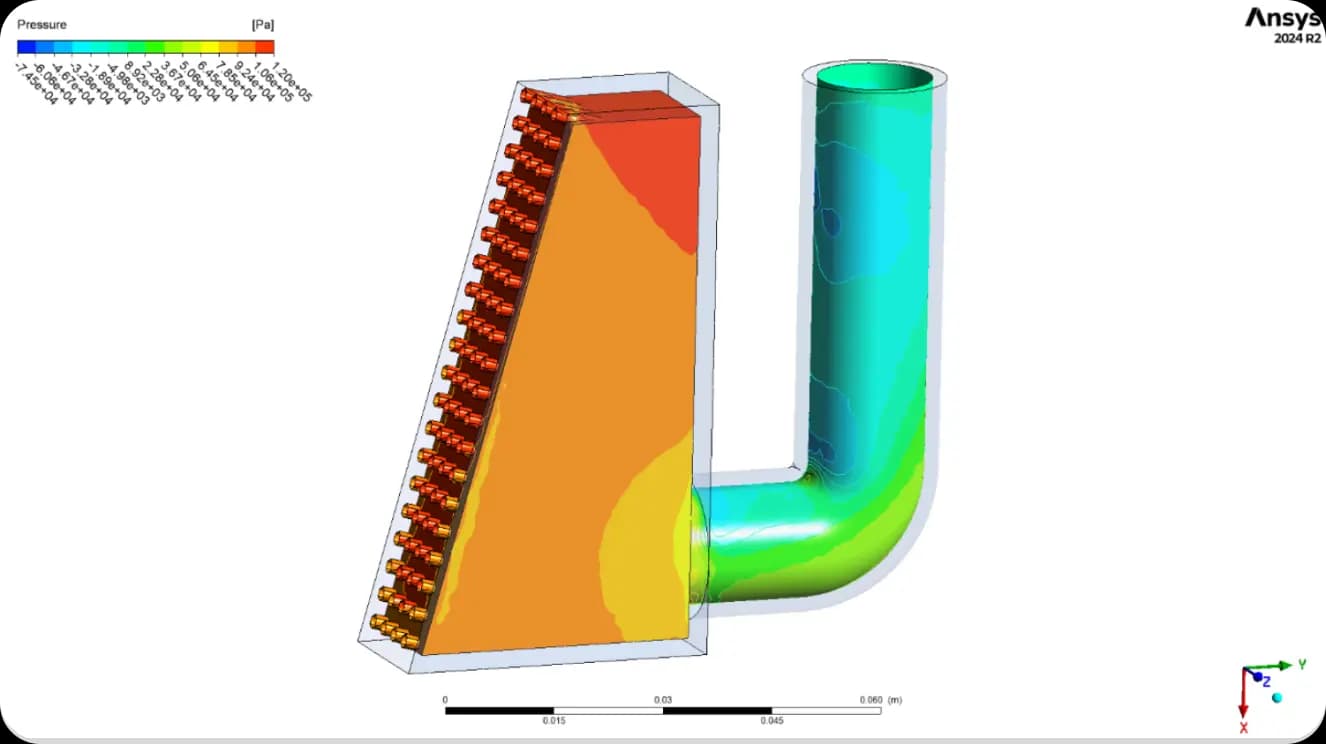
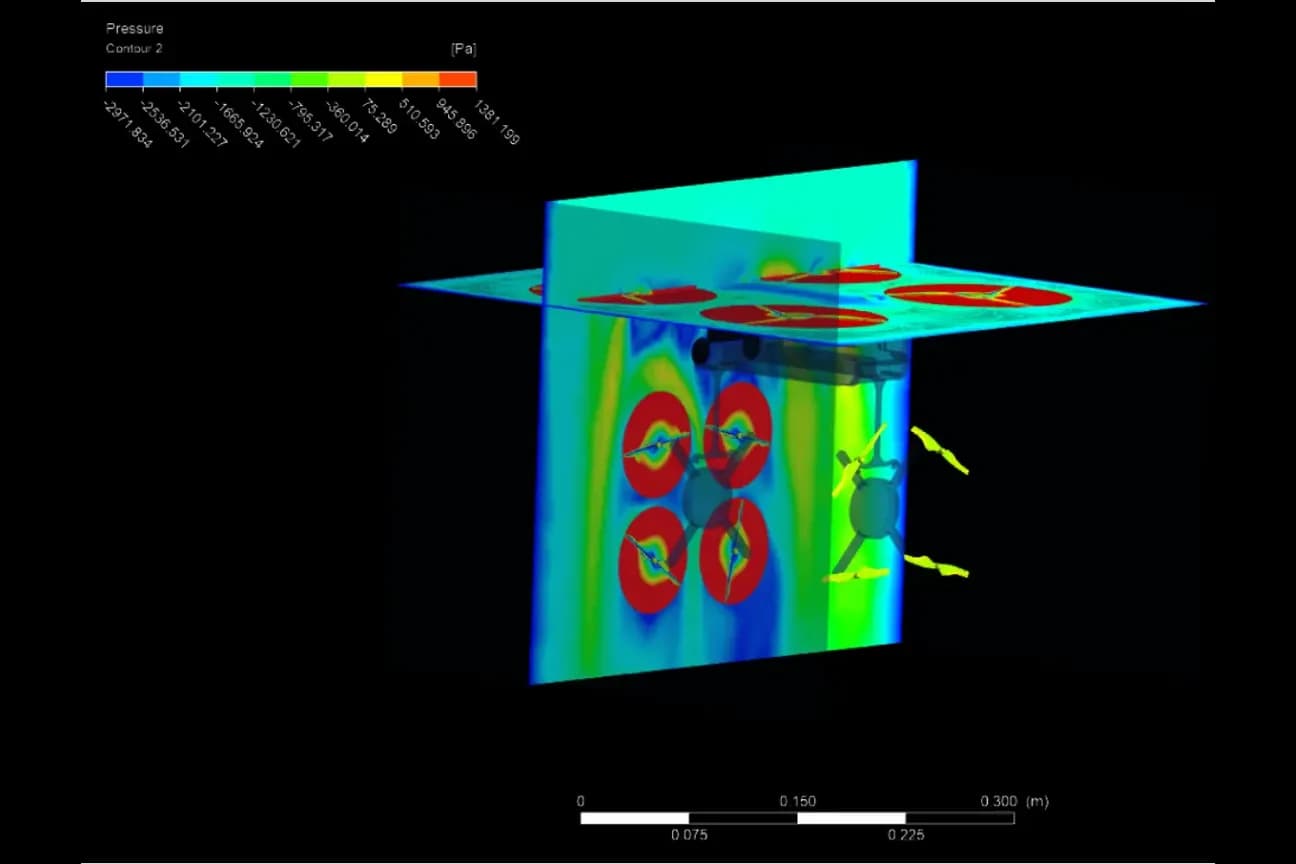
The pressure contours show where the energy goes:
What the results mean for the design
The study shows where design changes will pay off most: the losses across the fan region and the steep pressure gradients where the duct turns from horizontal to vertical. Improving these areas is the route to more uniform cooling, less recirculation and better aerodynamic efficiency, while the well-guided, low-swirl outlet flow confirms that the vanes and splitters are doing their job.
Frequently asked questions
What does a CFD analysis of a cooling duct show?
It shows how the air moves through the duct: where it speeds up, where it separates or recirculates and where it loses pressure. In this study, velocity streamlines and pressure contours showed well-guided flow with minimal swirl at the outlet, and the main pressure changes across the fan region and at the bend.
Where were the main pressure losses in the duct?
Pressure was highest at the inlet and near the rotor base, about 1.2 × 10⁵ Pa at its peak, and dropped clearly across the fan region and gradually along the duct, with marked gradients at the transition from the horizontal to the vertical section.
Which turbulence model was used, and why?
The SST k-ω model, in a steady, incompressible simulation in Ansys Fluent 2024 R2. It resolves the near-wall flow well, which matters for predicting separation and pressure losses in curved and confined ducts.
Which applications benefit from duct flow CFD?
HVAC systems, electronics cooling, battery thermal management and industrial ventilation: anywhere the duct design directly affects how evenly a system is cooled and how hard the fan has to work.